Complimentary Data Lesson
These two Data Lessons are examples of the resources based on Office 365 for Education that home-schoolers can use with your annual Home-Schooler.com account. Enjoy these complimentary lessons, courtesy of Microsoft.
- Learn more about Microsoft 365 for Education apps.
- To get your own Home-Schooler.com account for your home-school at the discounted rate (which includes Microsoft 365 for Education apps) visit the Get Started page.
- All activities are aligned to key Next Generation Science Standards (NGSS) and International Society for Technology in Education (ISTE) standards.
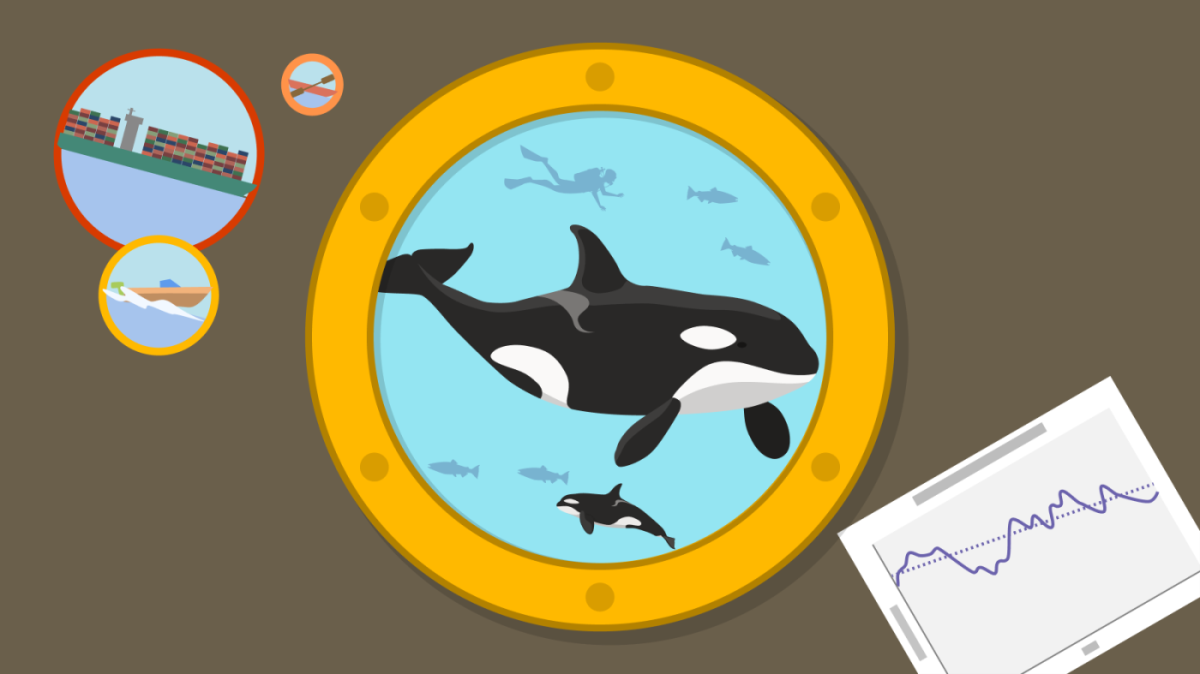
Meet Kiki and Her Family
Connect with the J pod population, a close-knit family of 24 endangered Southern Resident orca whales living in the Salish Sea, and specifically Kiki—a six-year-old female who carries the fate of the pod on her shoulders. Explore data related to Kiki and her family that may lead to insights that protect her family and their ecosystem.
Immerse your home-schooler in a fun and interactive data science project as you learn about Kiki and her family in the J pod. Choose from one or both of the 50-minute activities below.
Lesson 1 – Use data to research
Paddle your way into Kiki’s world through a self-paced Excel activity that introduces beginning concepts for data-driven research using linked data types.
Age: 11-14 years old
Length: 50 minutes
Lesson highlights:
- Access information in Excel using data types and data cards.
- Compare and contrast taxonomic data to explore differences and similarities of organisms.
- Use data cards to access geographic data related to orca sighting locations.
Learning standards:
- NGSS MS-LS4-2. Apply scientific ideas to construct an explanation for the anatomical similarities and differences among modern organisms and between modern and fossil organisms to infer evolutionary relationships.
- ISTE 5b. Students collect data or identify relevant data sets, use digital tools to analyze them, and represent data in various ways to facilitate problem-solving and decision-making.
Lesson 2 – Use data to investigate
Make a splash using data to investigate with a self-paced Excel activity that introduces beginning concepts for investigating a phenomenon using data.
Age: 11-14 years old
Length: 50 minutes
Lesson highlights:
- Investigate data to describe feeding relationships in an ecosystem.
- Explore multiple sources of data to explain how toxins can influence the health of populations in an ecosystem.
- Analyze multiple acoustic data to provide evidence for the effects of sound pollution on a population.
Learning standards:
- NGSS MS-LS2-1. Analyze and interpret data to provide evidence for the effects of resource availability on organisms and populations of organisms in an ecosystem.
- NGSS MS-LS2-4. Construct an argument supported by empirical evidence that changes to physical or biological components of an ecosystem affect populations.
- ISTE 5b. Students collect data or identify relevant data sets, use digital tools to analyze them, and represent data in various ways to facilitate problem-solving and decision-making.